Wall Street

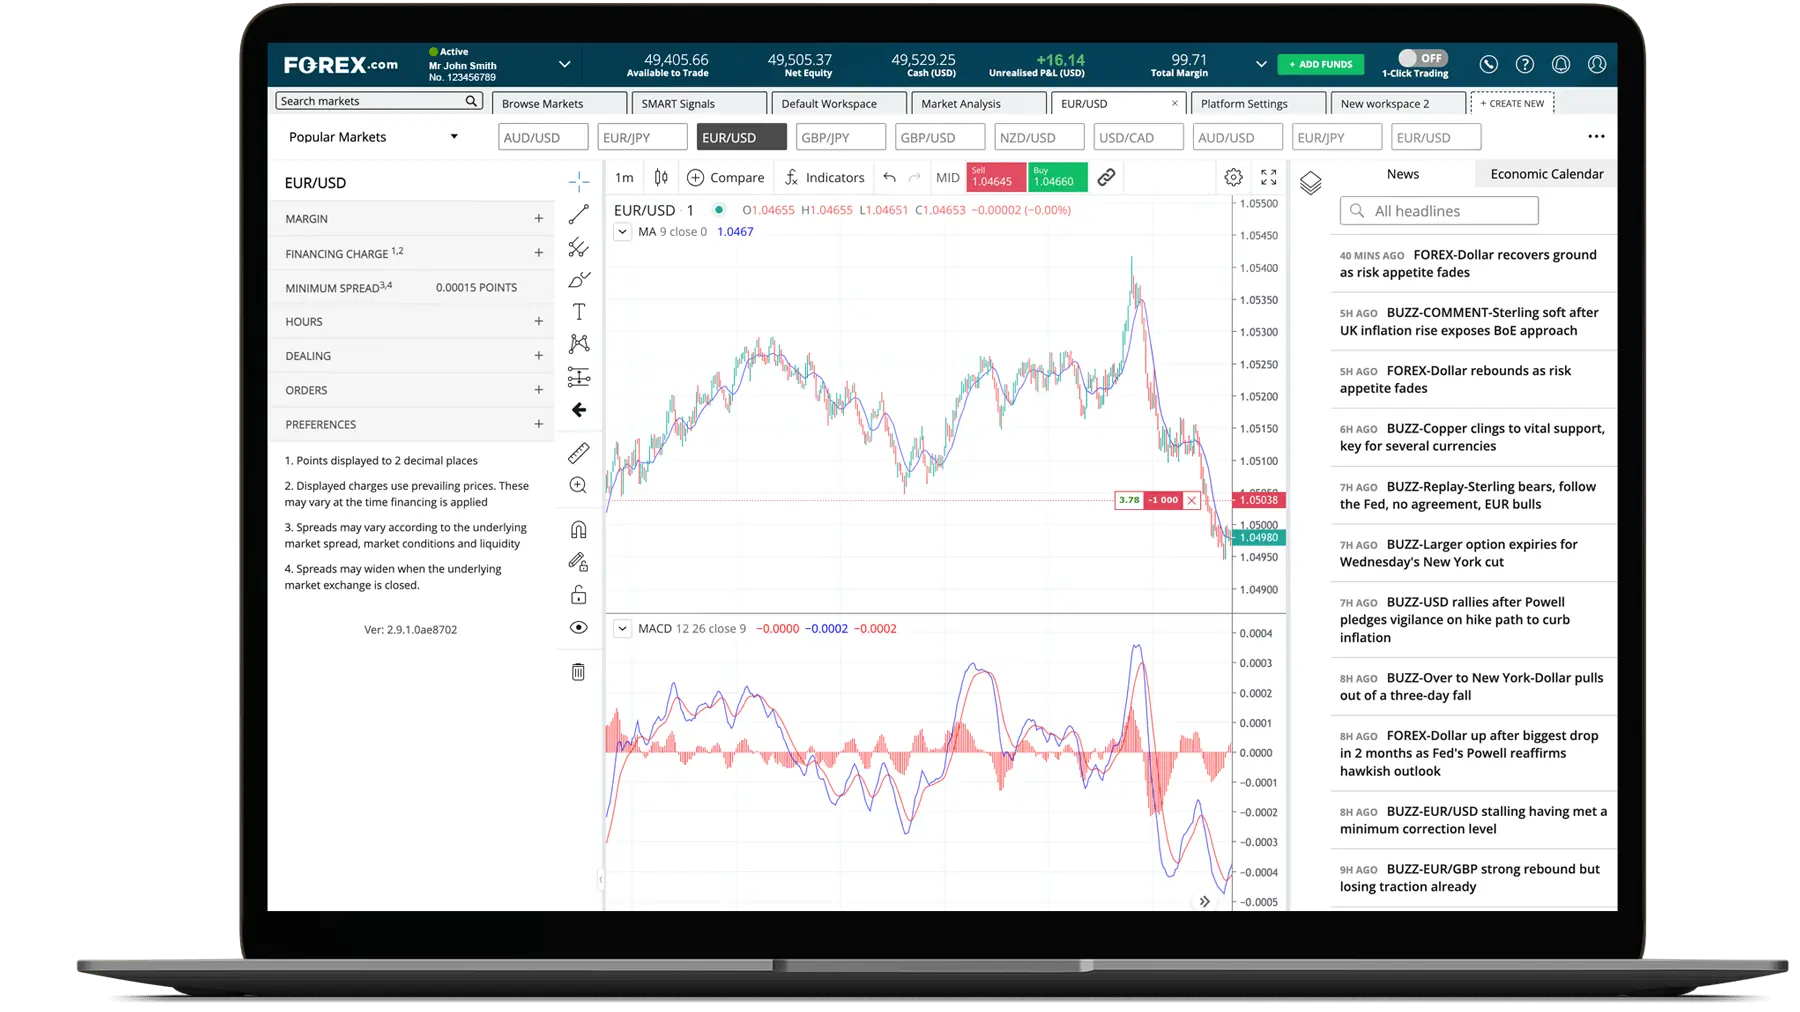
View indicative pricing and leverage information for Wall Street.

Price Chart

Wall Street chart

Price48552.0
Change %0.09%
Sell
48549.0
Buy
48555.0
6.0
  • Low:48488
  • Change43
  • High:48617
  • Change %0.09%

Wall Street insights

Pivot Points
TradingView
Performance Analytics

Pivot points are a technical indicator that traders use to predict upcoming areas of technical significance, such as support and resistance. They're calculated by averaging the high, low and closing prices of a previous period. That could be a day, a week or a month.

If a market is trading above its previous pivot point (known as P), it is seen as a bullish signal. If it is below, it is bearish.

Dailys
Weekly
Monthly
Pivot point
49356.7
High
49583.4
Bid
48549.0
Low
49046.4
Offer
48555.0
Close
49440.4
Distance
807.7

Support and resistance levels are a core part of technical analysis, providing crucial insight into possible future price reversals.

S1
49130.0
R3
99787.4
S2
48819.7
R2
49893.7
S3
48593.0
R1
49667.0
Last Updated 1/15/2026 11:59:59 PM
Test

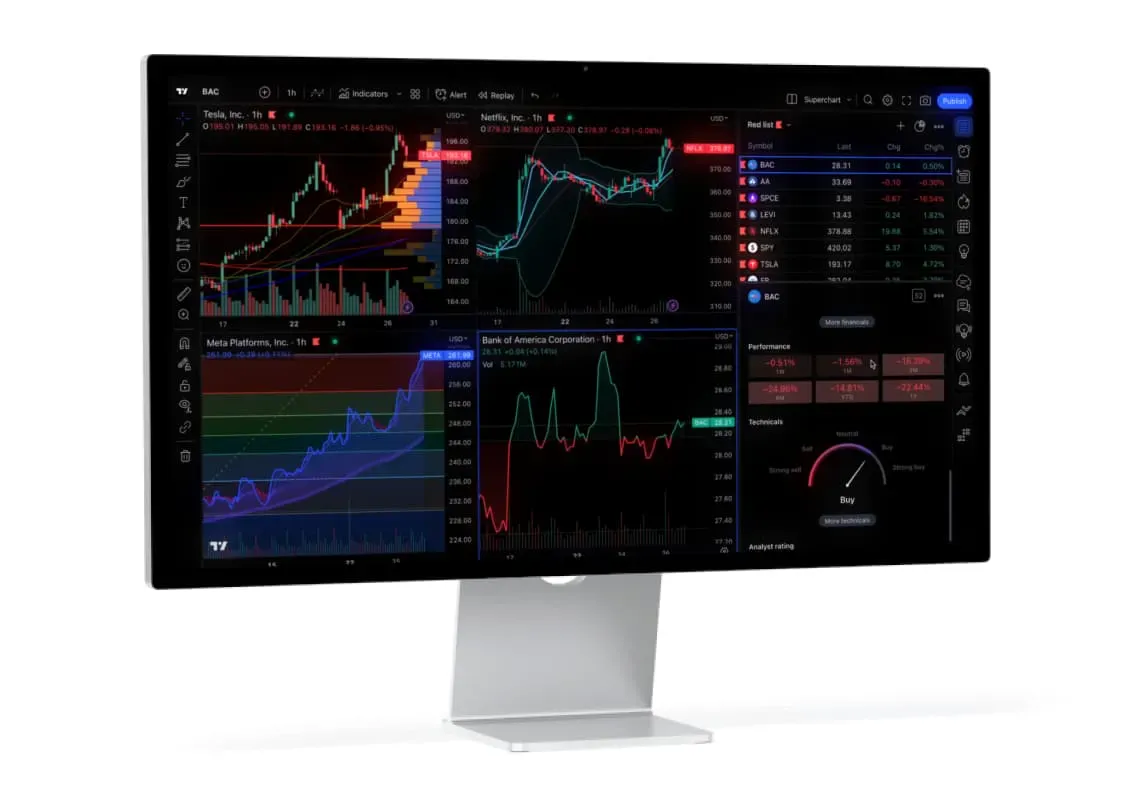
When you trade your FOREX.com account on TradingView.com, you benefit from sharing ideas and custom scripts with their community of over 60 million traders and investors*.

Their industry-leading charts and tools have seen TradingView receive a 4.7 rating for its mobile app with over 10M downloads**, making it one of the top financial platforms.

Whether you are new to trading or a seasoned investor, TradingView delivers on our joint mission to help anyone succeed in financial markets.

*Published by TradingView.

**Based on TradingView App review on Google Play.

When it comes to trading, it’s just as important to assess your own behaviours as well as the market’s. More than a modern-day trading journal, simply log into our trading platform and select the Performance Analytics tab for in-depth insights on your strengths and weaknesses.

Trade Indices Your Way


Access fractional contract sizes as small as 0.1 for greater flexibility and control.

Economic Calendar
GMT   事件 重要性 实际值 预期值 前值
星期二, 1月 20
24小时 AR 国旗日 0
24小时 EMU 欧盟财长会议 2
24小时 CH 世界经济论坛-达沃斯 2
星期三, 1月 21
07:00 UK 英国生产者输出物价指数月率(未季调) (12月) 2 0.0% 0.1% 0.1%
星期四, 1月 22
星期五, 1月 23
24小时, 星期二, 1月 20 0
24小时, 星期二, 1月 20 2
24小时, 星期二, 1月 20 2
07:00, 星期三, 1月 21 2

Indices explained

What are indices?

Discover everything you need to know about stock indices, including how to trade them and which markets are available to you.

Read more on what are indices
Was this answer helpful?

Why trade indices?

Trading indices enables you to get exposure to an entire economy or sector with one single position, instead of opening multiple trades across several companies.

Read more on why trade indices

Was this answer helpful?

How to trade indices

Want to know how to trade an index using CFDs? This section breaks down every aspect of your first trade.

Read more on how to trade indices
Was this answer helpful?

If you have more questions visit the Indices Trading FAQ section or start a Chat with our support team.

Looking to learn more about indices trading? Visit our trading academy and use our resources to become market-ready.

Laptop showing Forex Webtrader platform