Apple Inc

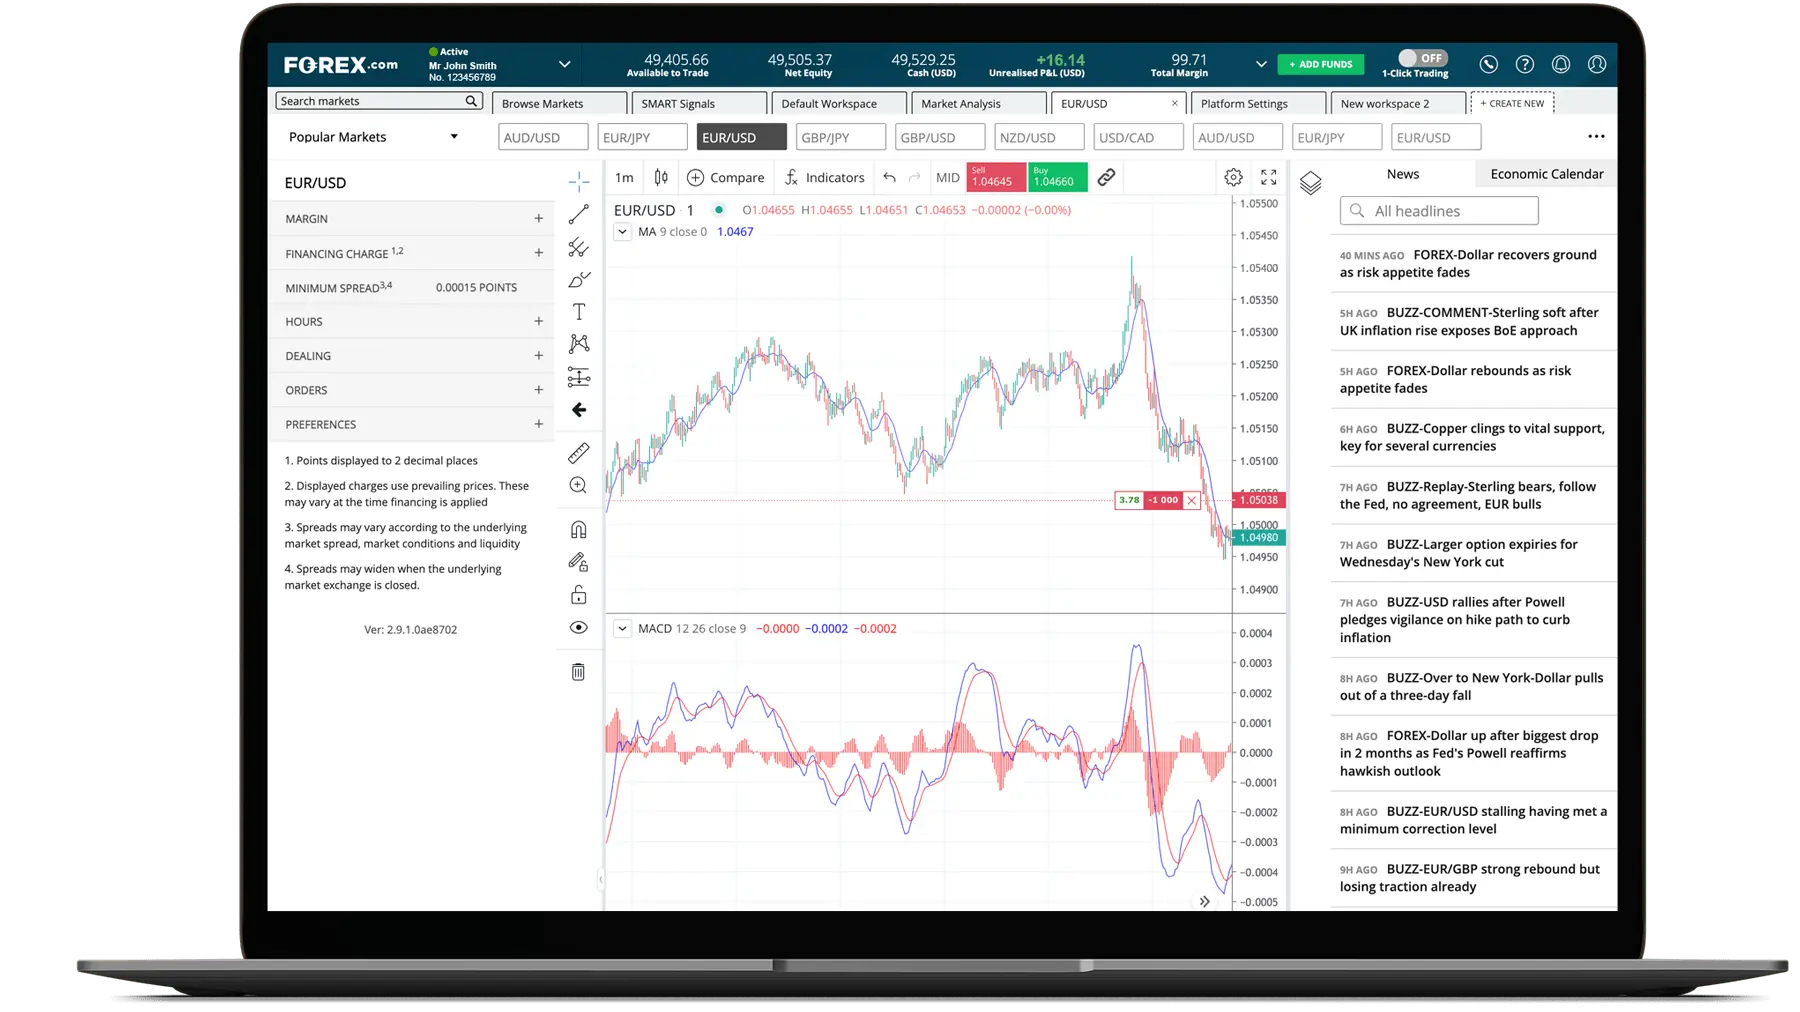
View indicative pricing and leverage information for Apple Inc.

Price Chart

Apple Inc share price chart

Price255.530
Change %1.05%
Sell
244.490
Buy
244.510
2.0
  • Low:243.42
  • Change-11.03
  • High:254.8
  • Change %-4.51%

Apple Inc insights

Pivot Points
TradingView
Performance Analytics

Pivot points are a technical indicator that traders use to predict upcoming areas of technical significance, such as support and resistance. They're calculated by averaging the high, low and closing prices of a previous period. That could be a day, a week or a month.

If a market is trading above its previous pivot point (known as P), it is seen as a bullish signal. If it is below, it is bearish.

Dailys
Weekly
Monthly
Pivot point
258.765
High
261.025
Bid
255.530
Low
257.060
Offer
255.530
Close
258.210
Distance
3.235

Support and resistance levels are a core part of technical analysis, providing crucial insight into possible future price reversals.

S1
256.505
R3
525.460
S2
254.800
R2
262.730
S3
252.540
R1
260.470
Last Updated 1/15/2026 9:00:00 PM
Test

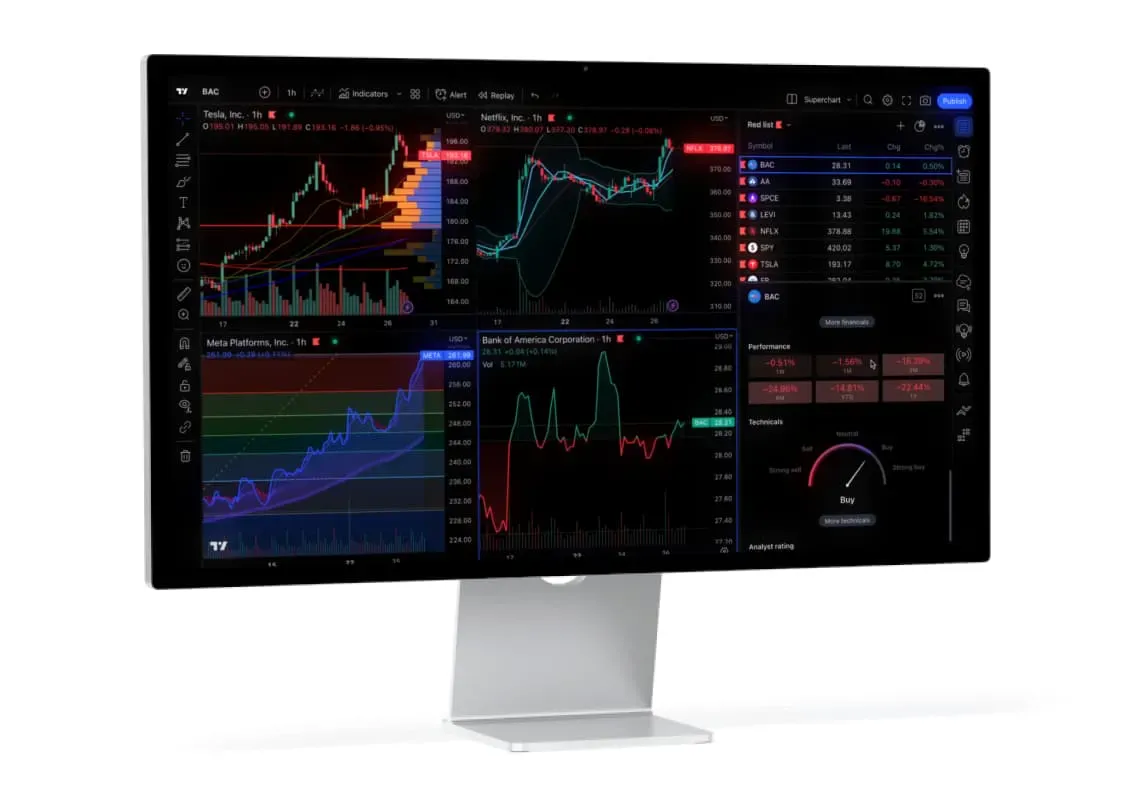
When you trade your FOREX.com account on TradingView.com, you benefit from sharing ideas and custom scripts with their community of over 60 million traders and investors*.

Their industry-leading charts and tools have seen TradingView receive a 4.7 rating for its mobile app with over 10M downloads**, making it one of the top financial platforms.

Whether you are new to trading or a seasoned investor, TradingView delivers on our joint mission to help anyone succeed in financial markets.

*Published by TradingView.

**Based on TradingView App review on Google Play.

When it comes to trading, it’s just as important to assess your own behaviours as well as the market’s. More than a modern-day trading journal, simply log into our trading platform and select the Performance Analytics tab for in-depth insights on your strengths and weaknesses.

Commission-free* trading on thousands of Stock CFDs


Go long or short and benefit from elite execution on some of the world's most popular stocks.

*Spread cost applies

Economic Calendar
GMT   事件 重要性 实际值 预期值 前值
星期二, 1月 20
24小时 AR 国旗日 0
24小时 EMU 欧盟财长会议 2
24小时 CH 世界经济论坛-达沃斯 2
星期三, 1月 21
07:00 UK 英国生产者输出物价指数月率(未季调) (12月) 2 0.0% 0.1% 0.1%
星期四, 1月 22
星期五, 1月 23
24小时, 星期二, 1月 20 0
24小时, 星期二, 1月 20 2
24小时, 星期二, 1月 20 2
07:00, 星期三, 1月 21 2

Stock CFDs explained

What is stock trading?

If you want to profit from a company’s performance, then trading stock CFDs is one way to do it. For additional information on what they are, the risks, and the key things you need to know please follow the link below.

Read more about what is stock trading

Was this answer helpful?

How to trade stock CFDs

Want to know how to trade stocks using CFDs without owning the underlying stock? This section breaks down how to profit from falling and rising prices.

Read more about how to trade stock CFDs

Was this answer helpful?

Why trade stock CFDs?

Stocks are one of the most popular asset classes to trade and are a favourite of longer-term traders. Trading stocks via CFDs, however, opens the door to even more trading possibilities.

Read more about why trade stock CFDs

Was this answer helpful?

If you have more questions visit the Stocks Trading FAQ section or start a Chat with our support team.

Looking to learn more about stocks trading? Visit our trading academy and use our resources to become market-ready.

Laptop showing Forex Webtrader platform