- Gold sees capitulation-style price action
- Volatility surges to multi-year extremes
- Price stretched after rapid upside acceleration
- Risk management and sizing take priority
Gold trades like a meme stock
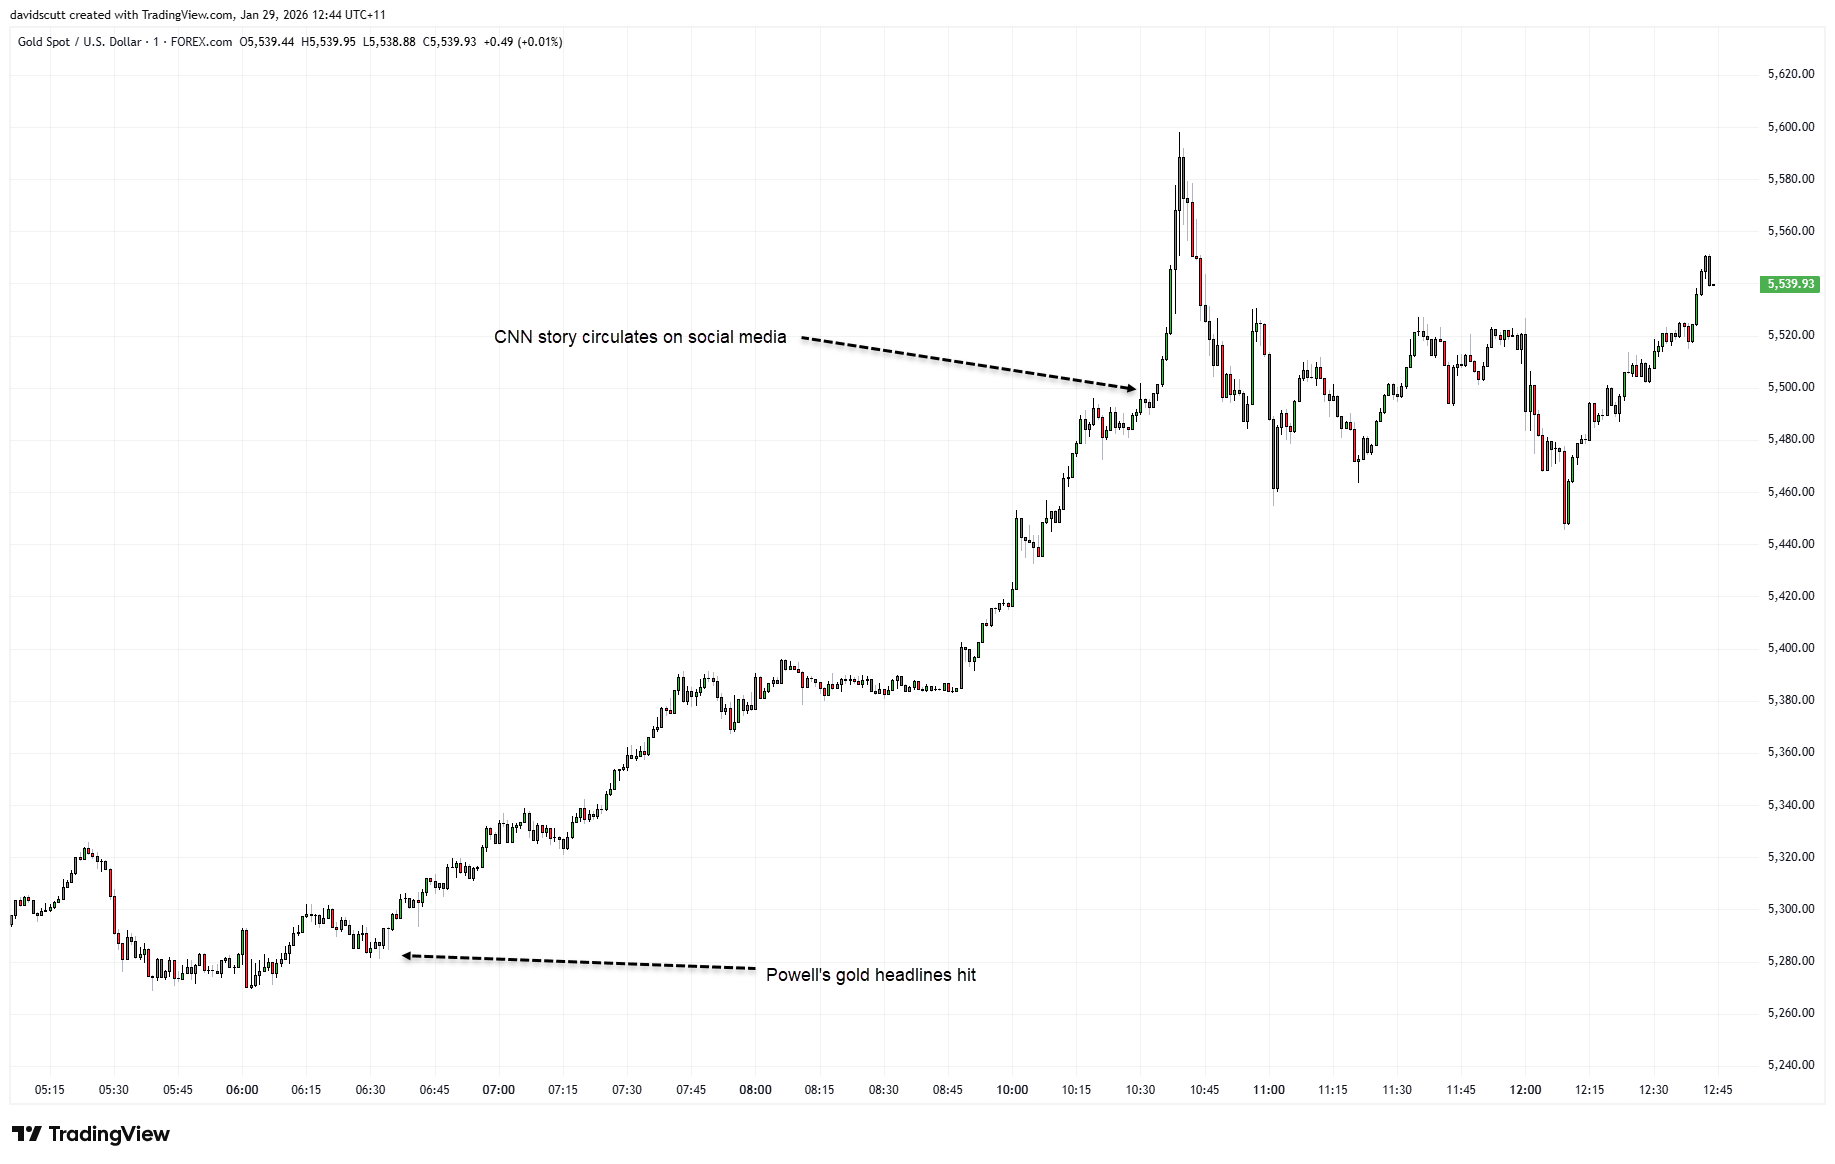
Gold traded more like a meme stock than a traditional safe haven on Thursday, with a near $100 surge unfolding in the space of minutes in early Asian trade, briefly lifting prices towards $5,600 before reversing just as sharply. The speed and scale of the move came across as capitulation watching it live, likely amplified by thin liquidity during the handover between North American and Asian sessions.
Source: TradingView
While the move began around the same time a CNN report emerged suggesting the US is weighing fresh military strikes against Iran, you would argue that risk should already be largely in the price given geopolitical tensions have been elevated for weeks, not just today. As such, the headline looks more like a trigger than a true driver. Some market participants also pointed to Fed chair Jerome Powell’s comments following the January FOMC meeting, where he dismissed any macro signal from record-high gold prices. However, those remarks appear a secondary consideration at best, arriving hours before the violent phase of the move played out.
Volatility shifts sharply higher
While today’s spike has understandably drawn attention, it is not an isolated event, instead forming part of a broader and accelerating expansion in volatility across the gold market.
Source: TradingView
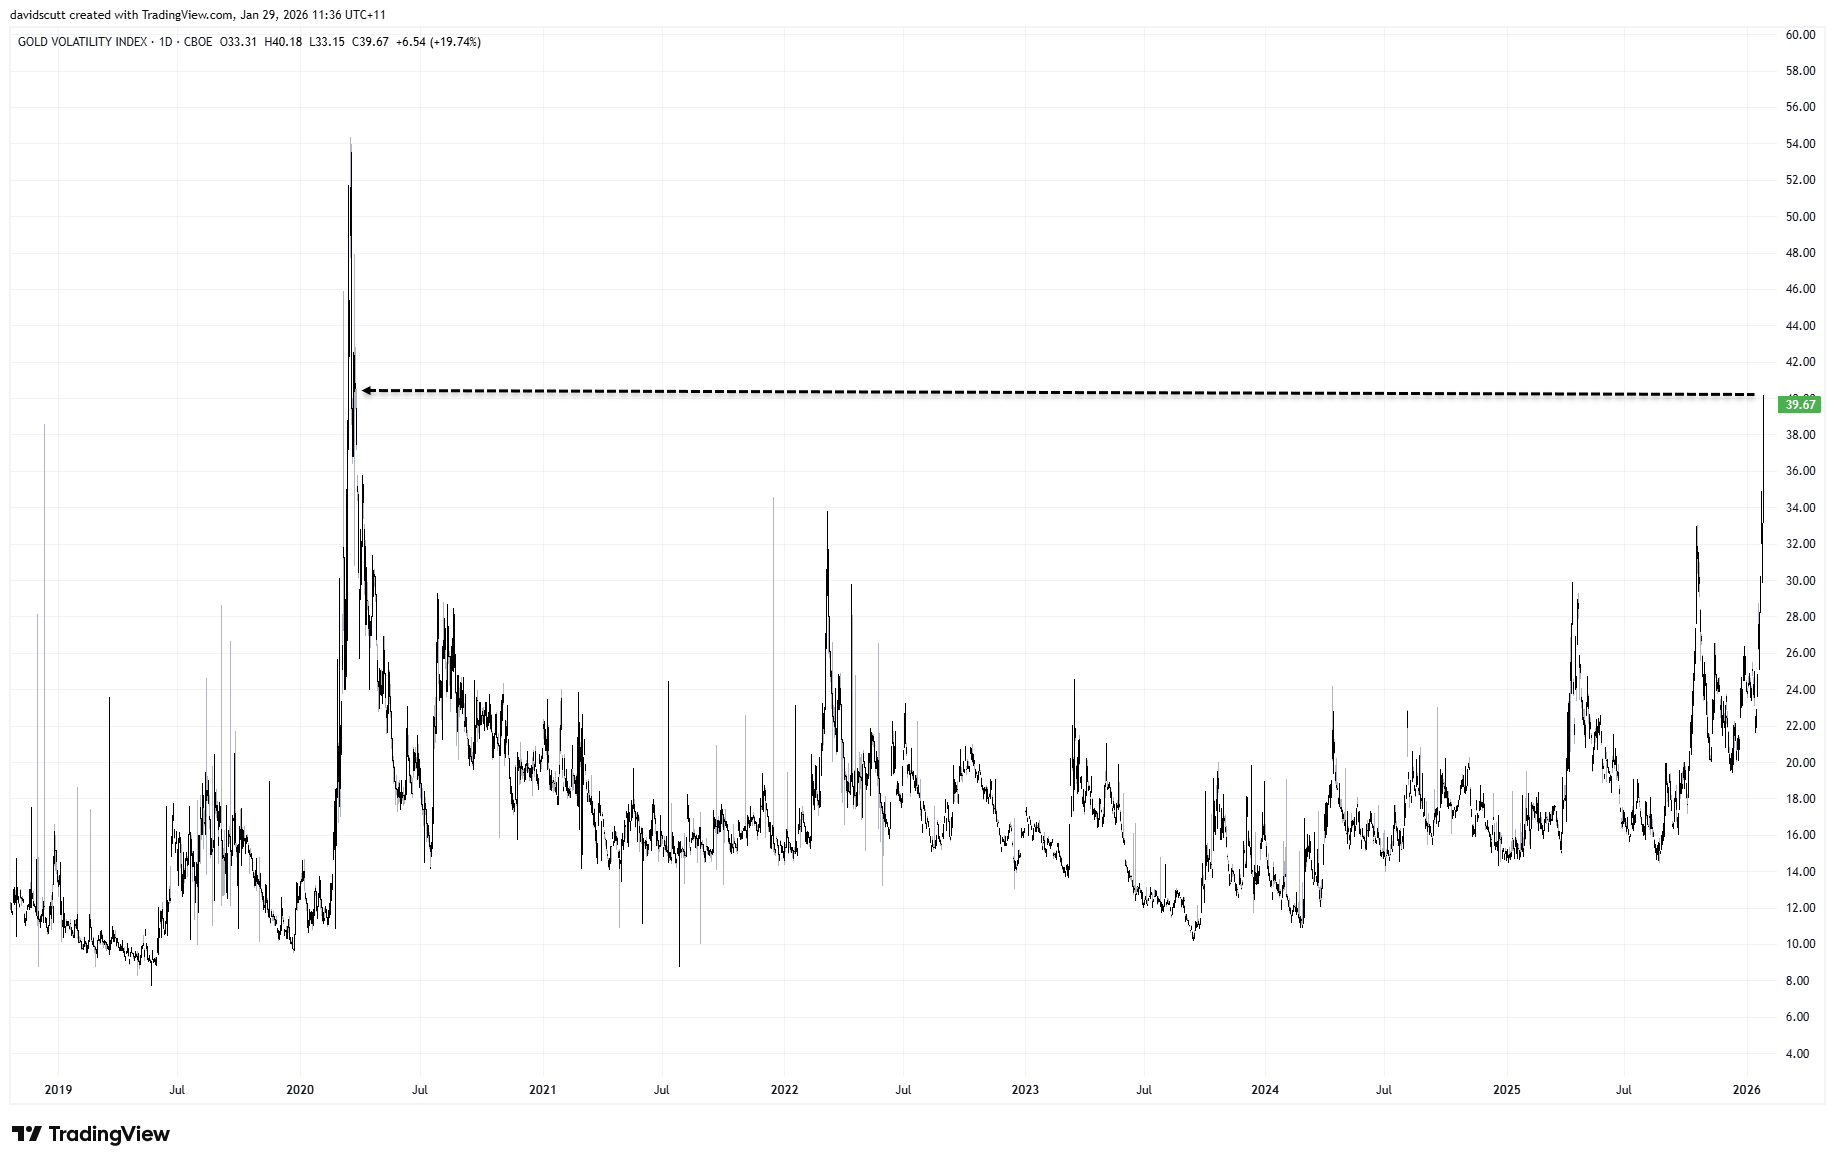
As shown above, the Gold Volatility Index (GVZ) has surged to its highest level since the early stages of the COVID lockdowns in 2020, underlining just how extreme price behaviour in the traditional safe haven has become. For context, GVZ tracks implied volatility in gold options, effectively giving a read on how much movement the options market is bracing for. The spike signals the market has shifted into a very different volatility regime, where outsized moves are becoming increasingly common.
Source: TradingView
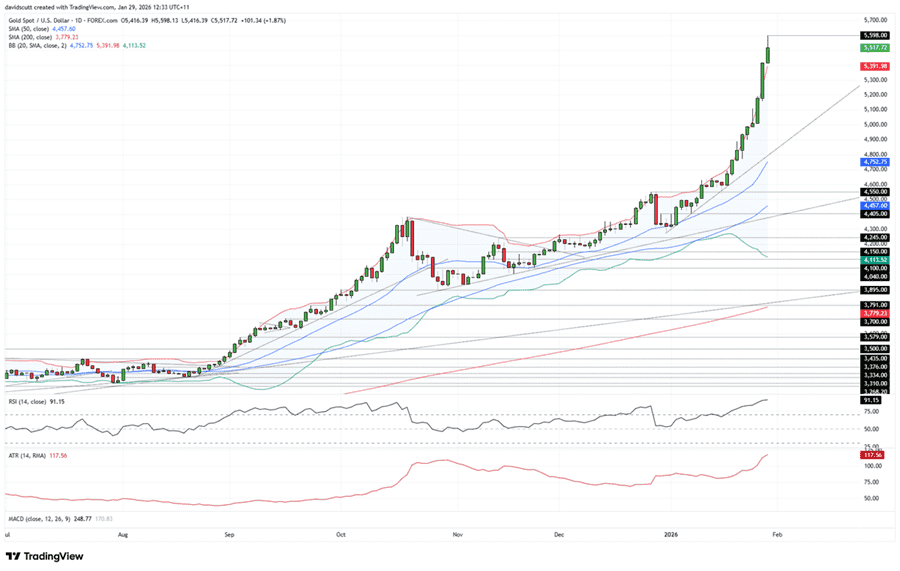
That broader volatility backdrop is also evident on the daily chart. Gold is trading above the upper Bollinger Band, underscoring just how far and how fast price has accelerated relative to recent conditions. Daily ranges have blown out, with ATR (14) sitting at an elevated 117.56, meaning $100-plus swings are now the norm rather than exception. At the same time, RSI (14) is deep in overbought territory at 91.15, reinforcing that while the broader bullish trend remains intact, price action is stretched and increasingly unstable.
Risk management becomes key
Put simply, this is a high-volatility environment with price action anything but normal. Gold has moved hard and fast, leaving it extremely stretched and prone to sharp, two-way swings even if the broader bullish trend remains intact. In conditions like these, traditional technical signals tend to be less helpful, with risk management and position sizing arguably more important, particularly when mean reversion risks are elevated.
.jpg)